For childcare and early childhood education centres across Queensland, NSW, and Victoria, June 30 marks something different from most industries. The end of the financial year does not arrive quietly. It is preceded by a rush of enrolment paperwork for the new year, family conversations about Child Care Subsidy entitlements and fee schedules, and the administrative load of preparing for what arrives next: the July school holidays.
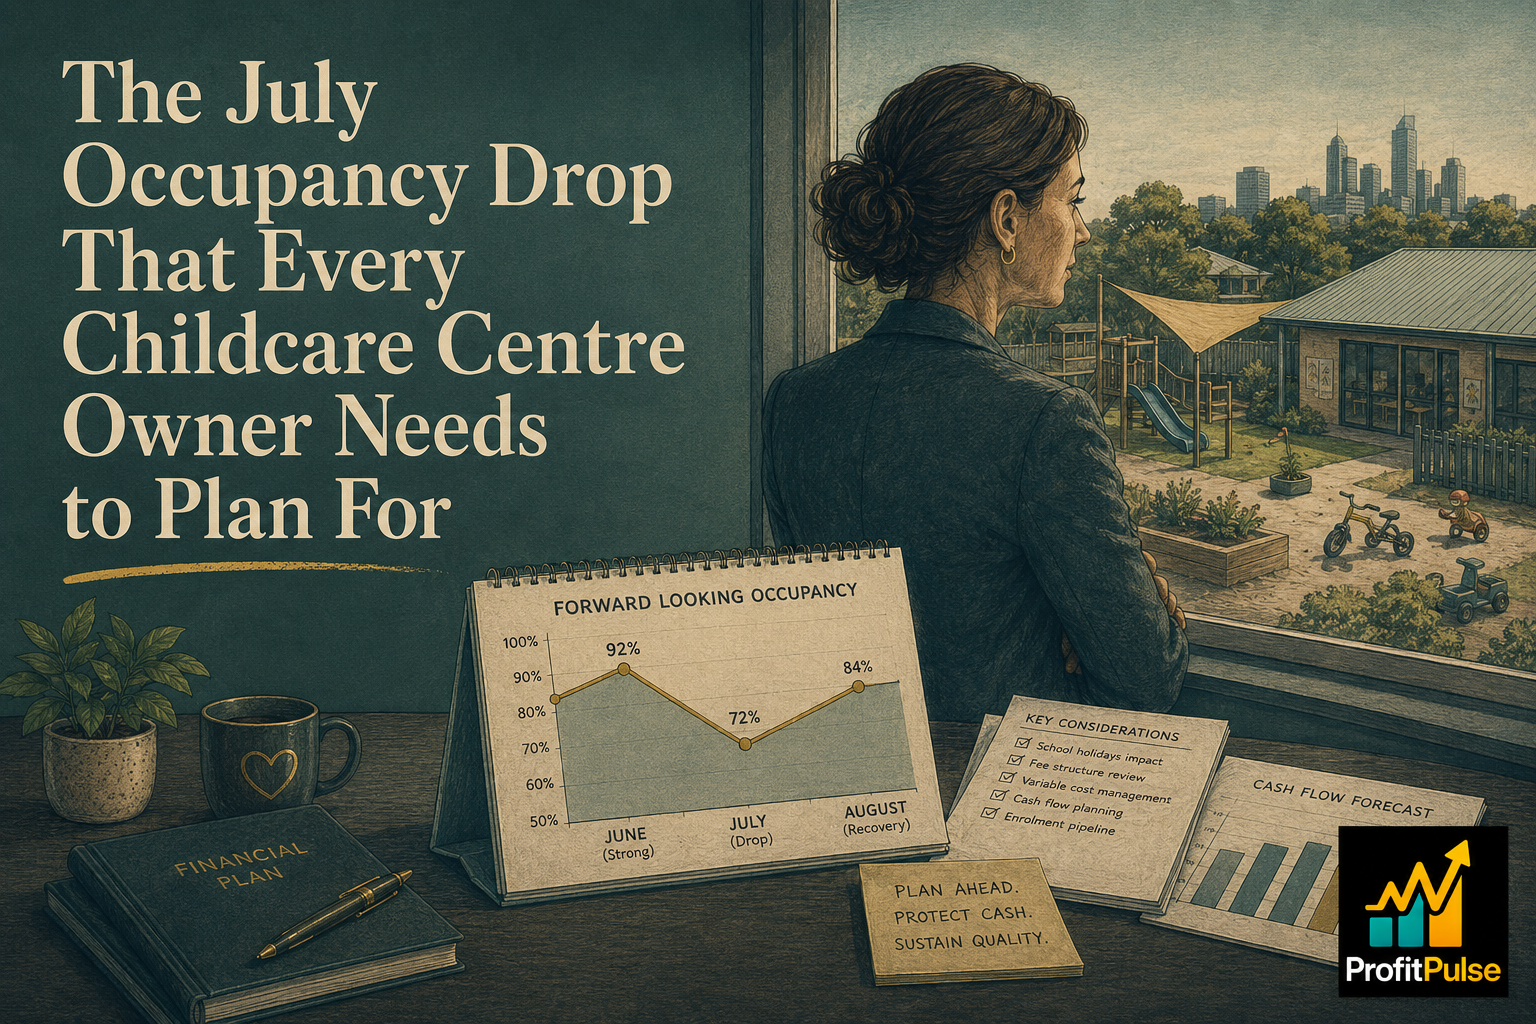
In most licensed centres, the July school holidays create a sharper occupancy drop than almost any other period in the calendar. Families with school-age siblings reduce sessions. Working parents take annual leave. Educators go on leave of their own. The transition from a near-full June to a quieter July happens within days of the financial year closing, and the revenue impact arrives before the new year’s operating rhythm has established itself.
This timing is not surprising to anyone who has managed a centre through a full year. What is surprising, for many centre owners, is how often they arrive at July without a clear plan for managing the gap.
The Occupancy Economics of a Mandated-Ratio Business
Childcare centres are regulated businesses. The minimum educator-to-child ratios mandated under the National Quality Framework are not negotiable; they define the minimum staffing level required regardless of how many children are booked on any given day. The wage cost of that minimum complement does not move with the session count. Whether a room is at full enrolment or running at sixty percent of capacity during school holidays, the minimum educator hours stay.
This structural feature of the childcare model means that occupancy percentage drives profitability far more directly than in most other service businesses. The difference between a strong occupancy month and a school-holiday month may represent the same cost base and a revenue gap that moves a room from contribution-positive to contribution-negative. This is why the July period concentrates financial risk in a way that June does not: occupancy drops predictably, costs hold steady, and the weeks either side of the new financial year carry fewer of the fully-booked days that help absorb fixed costs.
Centre owners who track occupancy percentage by room type across the year can see this pattern clearly in the data. Most already know it experientially. The commercial discipline is converting that knowledge into a forward plan that changes what is done in June, not in July.
The CCS Reconciliation Variable
The Child Care Subsidy paid by the Australian Government funds a portion of each family’s childcare fees throughout the year, based on their estimated household income and activity test results. After the financial year ends, Services Australia reconciles actual family income, drawn from ATO tax return data, against the estimated income used to calculate subsidy payments during the year.
Where a family earned more than their initial estimate, they owe the difference back to Services Australia. This reconciliation typically completes in the months following EOFY, once tax returns are lodged and processed. For most families, the outcome is manageable. For some, a reconciliation notice arrives alongside the July-August period when household discretionary spending is already being reviewed.
Centre owners in areas with higher proportions of families near the CCS income thresholds may see secondary occupancy effects in the months after EOFY: unexplained session reductions, temporary withdrawals, or families reducing to the minimum sessions that keep their subsidy active. Monitoring this pattern in July and August, and distinguishing it from the normal school-holiday recovery, helps centres identify whether enrolment softness is cyclical or requires a more active response.
Protecting the July Cash Position in June
The most effective planning for July happens in June, before school holidays begin and before the EOFY administrative load peaks. Three actions consistently make a difference.
The first is building a forward cash view. A 13-week cash flow forecast extended through September maps the July revenue profile against committed outflows. The key inputs for a childcare centre are anticipated occupancy by room for each week of July, the educator leave schedule, the timing of family fee payments on direct debit versus invoice cycles, and any CCS payment timing differences that occur when Services Australia processes the EOFY transition. The forward picture often looks different from the June 30 bank balance.
The second is a room-level contribution review. A Cost and Margin Deep Dive across the centre’s room structure, using twelve months of EOFY data, identifies which rooms generate margin, which are cross-subsidised by more profitable age groups, and where the occupancy threshold sits between a contributing room and a loss-making one during holiday periods. For most centres doing this exercise for the first time, at least one room will show a July margin outcome different from what the year’s average suggests.
The third is fee schedule timing. Where a fee increase is planned for the new financial year, communicating it in June for an August implementation separates the pricing conversation from the school holiday period itself. Families receive adequate notice, the centre avoids compounding the occupancy softness with a concurrent pricing change, and the August revenue reflects the new structure with enrolments stabilised after the holiday recovery.
ProfitPulse works with childcare and early childhood education operators across Queensland and NSW to build the financial visibility that the sector’s regulatory and seasonal structure demands. If your June occupancy is solid and your July and August position has not yet been mapped, building that forward picture now is the most useful financial work of the next four weeks. Book a complimentary 45-minute discovery call with ProfitPulse.
Frequently asked questions
Why do childcare centres face a revenue drop every July in Australia?
The July school holidays reduce session bookings across most licensed centres, because families with school-age children reduce care days and working parents take annual leave concurrently with school breaks. The revenue falls while the minimum educator complement, set by the National Quality Framework ratios, stays in place. The result is the same wage cost base supporting a smaller revenue pool. Most centre owners experience this pattern every year; the commercial discipline is planning for it in June rather than managing the consequences in July.
How do educator-to-child ratio requirements affect childcare centre profitability?
The National Quality Framework mandates minimum educator-to-child ratios that apply regardless of how many children are booked on a given day. A room that needs two educators for a full group still needs those educators when only half the group attends during school holidays. The wage cost of the minimum complement is largely fixed, which means occupancy percentage drives room-level profitability directly. Centres with strong occupancy year-round carry these fixed costs comfortably; centres with low occupancy periods absorb the same cost base against a materially lower fee income.
What is the Child Care Subsidy reconciliation and how does it affect childcare enrolments?
Services Australia pays CCS based on each family’s estimated household income throughout the year. After June 30, once ATO tax returns are lodged, actual income is compared to the estimate. Families who earned more than estimated may owe subsidy amounts back to Services Australia. For some families, this reconciliation notice arrives in the same period as the July school holidays and prompts a household budget review that includes reassessing childcare sessions. Centre owners in areas with higher CCS-dependent enrolments sometimes see secondary occupancy effects in July and August that track this pattern.
How can a childcare centre protect its cash flow through the EOFY period?
Three actions make the most practical difference before June 30. Build a forward cash flow model through September that maps the July occupancy drop and educator leave schedule against committed outflows. Review each room’s cost structure against the expected holiday-period occupancy to identify where roster planning within ratio compliance reduces cost exposure. If a fee review is planned, communicate the change in June for August implementation so the pricing conversation is separate from the holiday period. A 13-week cash flow forecast built for childcare incorporates the government payment timing differences that occur at EOFY.
What financial metrics should a childcare centre owner track regularly?
Occupancy percentage by room type is the primary operational metric because it drives room contribution margin directly. Revenue per enrolled child per week, the ratio of subsidised to full-fee families in each room, and staff cost as a percentage of room revenue together give a centre owner a clear view of which rooms are profitable, which are marginal, and where the business has capacity headroom versus where it is running at ratio minimums. Most centre management software can produce these figures; the question is whether they are being reviewed on a structured monthly cadence rather than only at EOFY.
When should a childcare centre review and implement fee increases?
The start of the new financial year, with implementation in July or August, is the natural point for the sector because it aligns with the annual enrolment review cycle and families expect annual pricing adjustments around this period. Communicating a fee increase in June, with four to six weeks notice before it takes effect, gives families adequate time to plan and separates the conversation from the school holiday period. A room-level cost review using EOFY data confirms which fee levels genuinely support the cost structure and which have drifted below their real cost of delivery.
What drives the valuation of a childcare centre or early education business?
The primary drivers are normalised EBITDA, occupancy stability across the year versus school holiday periods, the gap between licensed capacity and average enrolled capacity, lease terms and remaining tenure, National Quality Framework rating, staff turnover and team depth, and the degree to which the business depends on the owner’s personal involvement in operations. Centres with strong waitlists, stable occupancy, positive NQF ratings, and experienced management teams attract materially higher multiples than owner-dependent or occupancy-volatile businesses. Business valuation for Queensland SMEs covers the childcare and early education sector specifically.
Leave a Reply