
Why Growing MRR Doesn’t Always Mean a More Profitable SaaS Business
Monthly recurring revenue can climb for quarters while gross margin quietly slides underneath it. Here is where the margin actually leaks in a growing Australian SaaS business.

Monthly recurring revenue can climb for quarters while gross margin quietly slides underneath it. Here is where the margin actually leaks in a growing Australian SaaS business.

Christmas stock orders go out in August, and the exchange rate, freight cost and duty locked in this month decide an importer’s margin long before December trading begins.

Two practices with identical billings can sell for very different prices. In our experience, the gap usually comes down to one test: what happens to the clients when the partner steps back.

Yield and grain price get all the attention, but the number that actually decides whether a season was profitable is cost of production, and most producers have never sat down and worked it out.

Membership revenue in a fitness studio can stay steady through winter while real attendance quietly drops away, and that gap is where the next cancellation wave and margin loss begin.

A consolidated P&L can make a five-site franchise group look healthy while one location quietly breaks even for years. New financial year budgeting is the moment to see each site for what it actually is.

A quiet July production run does not show up as a cost blowout on the P&L. It shows up as a margin that quietly compresses while the standard cost sheet insists nothing has changed.

Sales commission looks like growth on the P&L, but property management fee income is what buyers actually pay a multiple for. Here is what the rent roll number is really telling you.

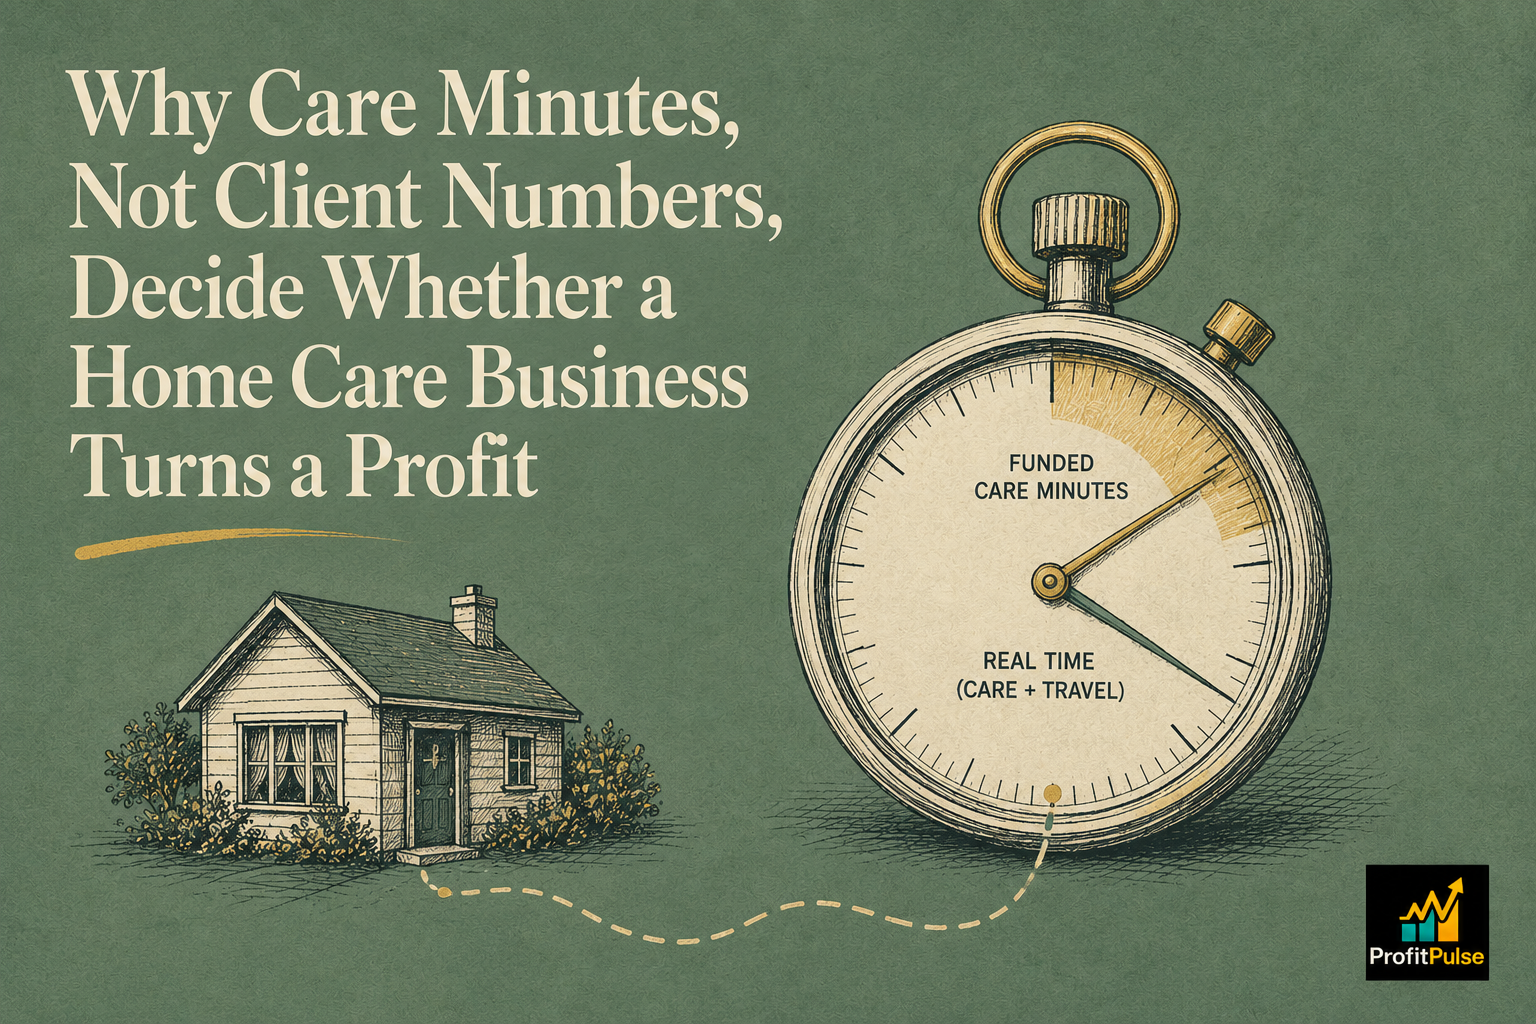
Home care and aged care providers usually track client numbers as the sign of growth. The number that actually decides profit is how many care minutes each client consumes against what funding covers.

Grant funding and trading income sitting inside one P&L can make an Indigenous-owned enterprise or social enterprise look profitable while its commercial arm is quietly being carried by money meant for something else.

A full appointment book doesn’t guarantee strong clinic profitability. The number that actually explains your practice’s margin is the billable ratio, and most practice owners have never calculated it.

Utilisation tells you how busy the team is. Realisation tells you how much of that work actually becomes revenue. For most Queensland engineering and architecture firms, the second number remains unmeasured.

For bricks-and-mortar retailers, the June 30 stocktake is a compliance exercise. But it produces the one calculation that shows what every clearance and markdown actually cost across the year.

The June booking surge in physio, psychology, and OT practices looks strong on paper. But the revenue total hides which billing streams drove the margin, and what that picture means for next year’s decisions.

June fills the booking sheet, but a full venue and a profitable one are different things. For Queensland cafés and restaurants, food cost and labour percentage tell the real story before July arrives.

A vet practice earns from consultations, dispensing, surgery, and diagnostics. Each has a different margin profile. Most principals don’t know which one is carrying the business until EOFY makes the picture clear.

Every July, NDIS providers absorb a wage increase before new pricing reaches active participant plans. The margin gap is predictable and the timing is fixed. Planning for it before June 30 changes how the new year starts.

Construction businesses often have strong revenue and solid profit. But the number a buyer arrives at consistently surprises owners who have not understood how WIP, retentions, and dependence affect the multiple.

Transport operators know their busiest routes. Far fewer know which routes are actually profitable after fuel, tolls, driver hours, and vehicle costs. EOFY is when twelve months of data make that picture possible.

June billings look strong. But retentions are withheld, WIP sits unclaimed, and July’s obligations arrive before client payments do. The gap is predictable. It just rarely gets planned for.

July school holidays empty rooms that were nearly full in June. For childcare centres with mandated educator ratios and fixed operating costs, the revenue drop is predictable. The cash response should be too.

June is the busiest month in the residential solar calendar. The STC mechanism, materials timing, and unit economics across job types create specific financial pressures that repeat annually and deserve a plan.

June fills every allied health appointment book. The private health fund extras rush looks like your best month. But item mix compresses, cash arrives in July, and the margin picture rarely matches the revenue one.

Most dental principals measure chair utilisation. Far fewer track recall effectiveness. The gap between those two numbers is where practice revenue quietly disappears month after month.

Franchisees and multi-site owners read the group result and miss that a strong site is masking a weak one. As EOFY consolidates everything, here is how site-level reporting reveals the truth.