June is the month where many owner-led businesses see their strongest revenue of the year. EOFY-driven activity, project completions, and a natural push to clear work before the books close tend to lift the top line in the final weeks of the financial year.
But revenue at the top of the profit and loss statement is a summary. It adds up every dollar that came through the business, regardless of what it cost to earn it. And for most businesses, the story behind that summary is considerably more interesting than the total itself.
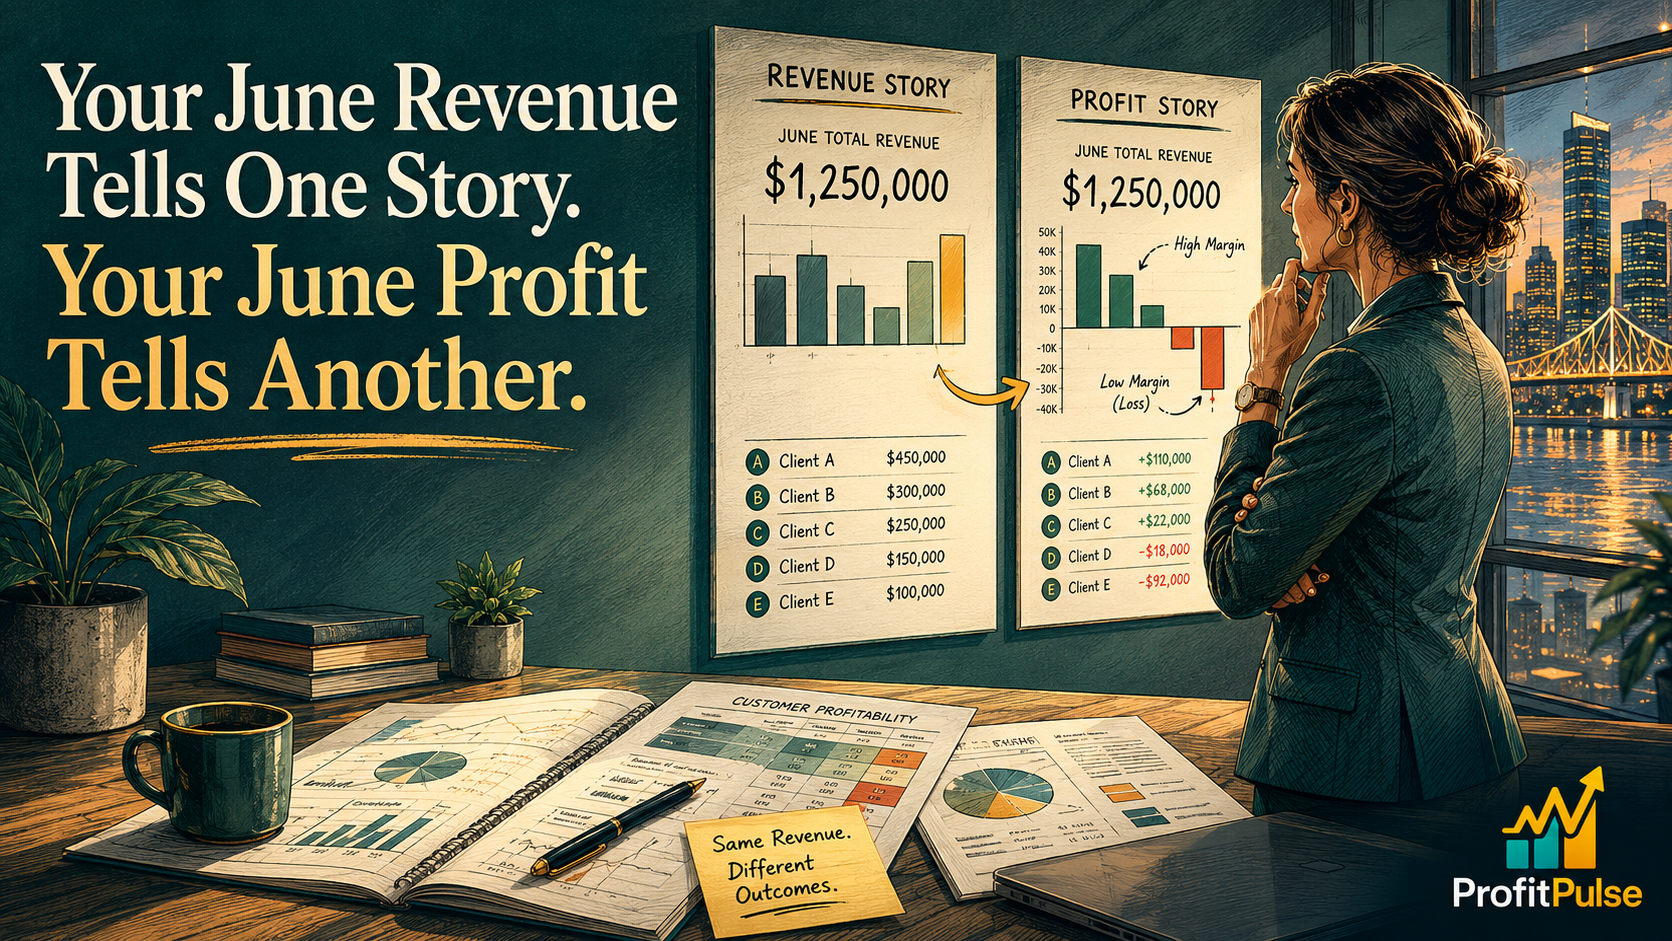
The customers who generated the most revenue in the year are rarely the ones who generated the most profit. The service lines that felt busiest are not always the ones that contributed most to margin. The work that came with the biggest invoices sometimes came with the biggest overheads, the longest payment terms, or the most hours of owner and team time. These gaps between revenue and profit at the customer level are visible when you look for them. For most businesses, no one looks.
What the P&L Total Cannot Tell You
The profit and loss statement prepared at year end is exactly what it is designed to be: a compliant, accurate summary of the business’s financial result. It tells you total revenue, total cost of goods, gross profit, total expenses, and net profit. It is what the ATO needs, and your bookkeeper and accountant produce it precisely for that purpose.
What it cannot show you, without additional analysis, is which customers generated margin and which consumed it. Which service lines carried overhead disproportionate to the revenue they brought in. Which client relationships are worth growing and which are delivering volume at the cost of profitability.
Most businesses assume this picture would simply mirror the revenue ranking. The largest clients are probably the most profitable. The highest-volume services probably deliver the best margin. These assumptions are often wrong, and June is the natural moment to test them.
The Three Patterns That Usually Appear
When a profitability analysis is run at the customer or service-line level, three patterns tend to emerge across most owner-led businesses.
The first is the high-revenue, low-profit client. This is the customer who accounts for a meaningful share of the top line but requires substantial management time, pays beyond standard terms, drives scope beyond what was originally priced, or generates rework and service costs that erode what looked like reasonable margin at the outset. This client appears strong in the revenue column and weak or neutral in the profit one.
The second is the smaller client who contributes disproportionate profit. These tend to be well-scoped relationships with clients who pay promptly, have predictable needs, and require little ongoing management. Because they do not dominate the revenue line, they rarely receive the attention their profitability justifies. When these relationships end, the impact on cash is often felt well before the impact on revenue can be explained.
The third pattern is concentration. For most businesses, a small proportion of customers generate the majority of profit. Knowing which relationships those are is not purely a profitability question; it is also a risk question. A business whose top two or three profit-generating clients were all lost in the same quarter would feel it immediately, regardless of what the overall revenue line showed.
Why EOFY Is the Right Moment for This Work
With twelve months of transaction data available, the weeks around June 30 are the natural point for this analysis. The data is complete. The patterns of the year are visible. And the decisions that flow from what you find, which clients to nurture, which service lines to protect, which relationships to move on from, shape the profitability of the entire year ahead.
A customer profitability review works from the revenue data by customer or service line, layered with the direct costs and team time associated with each relationship. Most businesses that run this exercise for the first time find at least one client relationship that is consuming considerably more than it is contributing, and one or two that have been undervalued and deserve more focused attention. Both findings change how the business is run in the year ahead.
There is a practical discipline that follows from this analysis. The decisions made about pricing, scope, and client selection in July and August are the decisions that determine whether next year’s result looks similar to this one or materially different. Making those decisions from a clear view of where the profit actually came from is more useful than making them from the revenue totals alone.
ProfitPulse works with owner-led businesses across Queensland and NSW to build this customer-level picture at the point in the year when the data is richest and the implications for the next twelve months are sharpest. If your June revenue numbers look satisfactory but you are not yet certain which customers drove your profit, that is the analysis worth building before the year closes. Book a complimentary 45-minute discovery call with ProfitPulse.
Frequently asked questions
How do I find out which customers are actually profitable in my business?
Start with your revenue data sorted by customer and subtract the direct costs associated with each relationship. For service businesses, include the hours your team spends per account relative to the fee charged. For product businesses, include fulfilment, delivery, and any returns cost. Most of this sits in your accounting system already. A customer profitability review typically takes three to four weeks and usually surfaces at least one relationship that looks healthy by revenue but sits neutral or negative by margin.
Why does my revenue look strong but my profit feel disappointing at EOFY?
Because revenue and profit do not always move together at the line level. A year with strong top-line growth can include several client relationships that consumed more in time, overhead, and scope than they returned in margin. The total profit figure in the P&L shows the net result but hides these individual patterns. When revenue grows but margin does not follow, the most likely explanation is that growth came from lower-margin work rather than from the relationships that generate strong returns for the business.
What is a customer profitability analysis and how does it work?
A customer profitability analysis ranks every client by margin contribution rather than revenue. It takes the revenue from each relationship and subtracts the direct costs of serving them, including materials, labour time, support, and any client-specific overhead. The result is a margin ranking that often looks quite different from the revenue ranking. Most owner-led businesses find their top three revenue clients are not the same as their top three margin clients, and that the spread within the portfolio is wider than expected.
Should I exit low-margin clients to improve my business profitability?
Not necessarily, and not before understanding why the margin is low. A low-margin client may be priced incorrectly, served with more overhead than the relationship warrants, or generating referrals and strategic value that justify the economics. The more useful first step is identifying which relationships are genuinely low-margin and which are strong contributors in ways the revenue figure does not show. Exit decisions are most effective after that clarity is established, because removing the wrong client can open a larger gap than the margin improvement suggests.
What is customer concentration risk and why does it matter for Australian SMEs?
Customer concentration risk is the exposure that comes when a small number of clients generate most of the profit. A business whose top two or three relationships account for the majority of margin is significantly exposed if any of them changes. For most Australian SMEs this risk sits not just in revenue but in the margin profile: a business can appear diversified on the top line while being highly dependent when profit is mapped by client. Knowing where that concentration sits changes how the business plans the year ahead.
How does a fractional CFO help improve profitability in an owner-led SME?
By building and maintaining the visibility that most owner-led businesses lack at the client and service-line level. Most owners know their total profit. Far fewer can rank their clients or service lines by margin without significant effort. A fractional CFO installs the reporting that keeps this picture current, so that decisions about pricing, scope, and client selection are made with a clear view of which revenue actually works for the business rather than which revenue looks largest.
When is the best time to review customer profitability for an Australian SME?
The period immediately after EOFY, when twelve months of complete data are available, is the natural moment because the findings directly inform decisions about the year ahead. A secondary review mid-year catches patterns that have shifted significantly. Businesses growing quickly or experiencing significant changes in their client mix benefit from more frequent analysis. ProfitPulse’s profitability services can be structured as an annual review or as part of an ongoing advisory arrangement depending on the business’s stage.
Leave a Reply