
June in Queensland hospitality is rarely quiet. EOFY functions fill the diary, corporate clients clear entertainment budgets before 30 June, and the winter weekend trade firms up for venues with solid indoor settings. The booking sheet looks strong. The kitchen runs at pace. The bar is busy.
What the full venue does not automatically reveal is whether the business is making money.
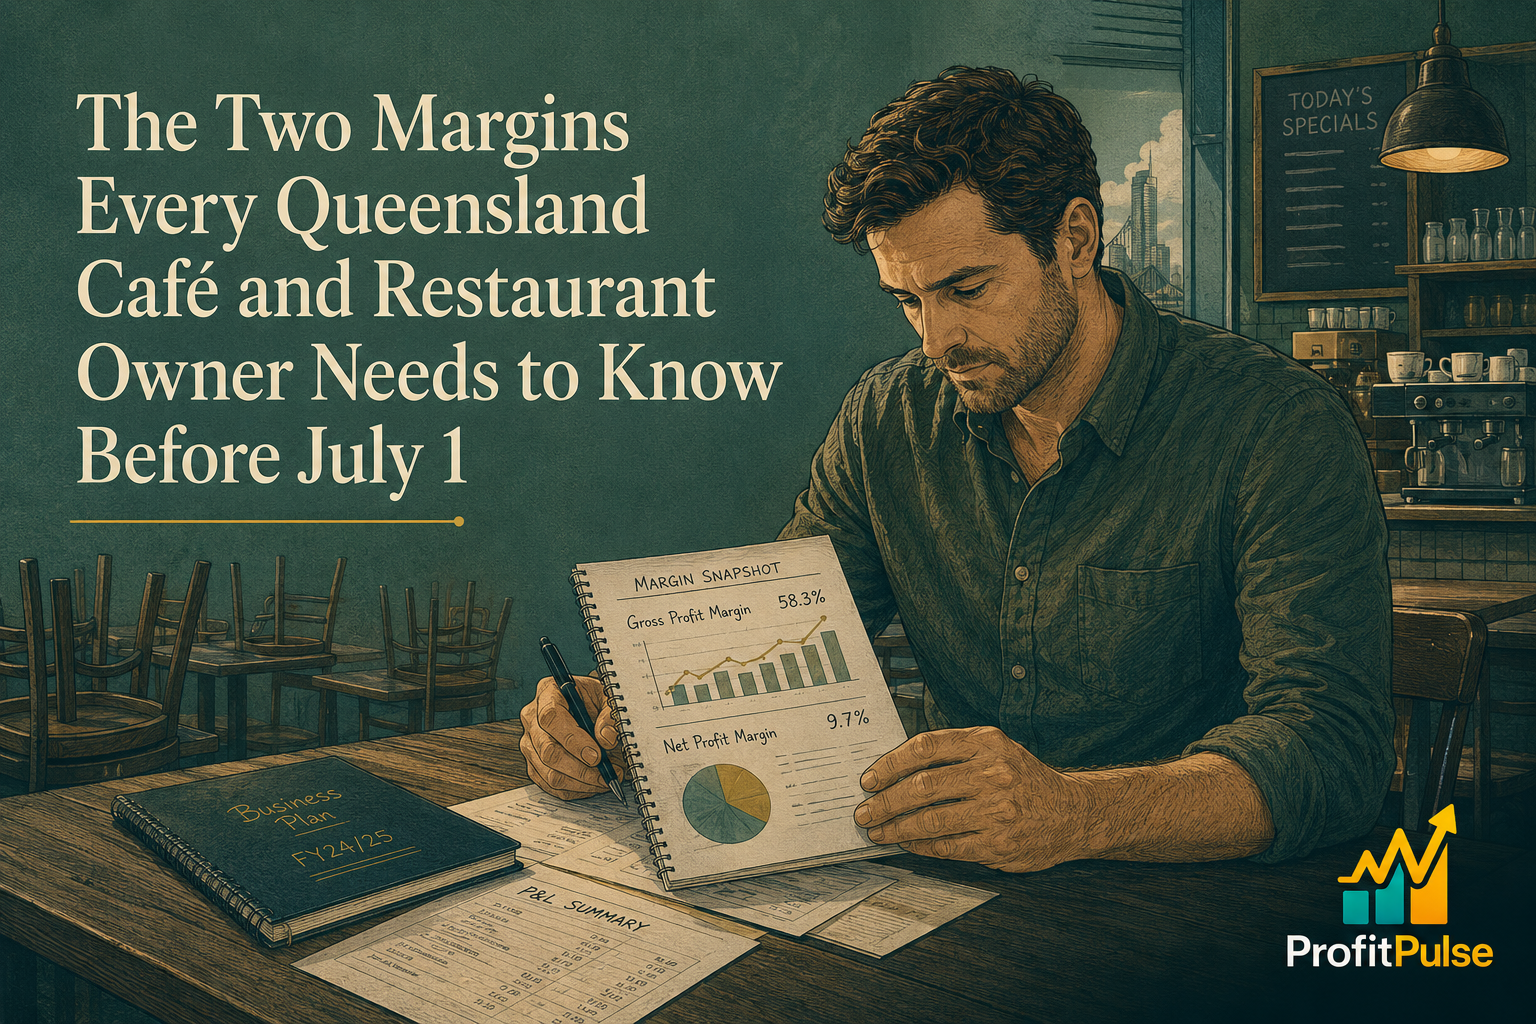
In hospitality, busyness and profitability are closer than in most industries but more deceptive than they appear. A café running at capacity through June may be doing so with a food cost percentage that has drifted several points since anyone last calculated it carefully, a labour percentage that has absorbed two rounds of award increases without a corresponding pricing review, and a year-end stocktake that gets conducted for compliance purposes but never interrogated for what it says about the actual cost of serving each item on the menu. The gap between activity and margin becomes visible at EOFY, provided someone is looking for it.
The Food Cost Percentage That Drifts While the Business Runs
Food cost percentage is the share of food revenue consumed by ingredient cost. For most café and restaurant models on the East Coast, it sits somewhere between 28 and 38 percent of food revenue. Where it lands precisely depends on cuisine type, supplier arrangements, and service model. What matters most for any individual venue is not the industry average but how the current figure compares to the same venue’s own number twelve months earlier.
In most hospitality businesses, food cost percentage is calculated carefully at opening. Cost-per-dish analysis is built. Menu prices are set to hit a target margin. Then trading begins, and several things happen without any deliberate decision.
Supplier invoices arrive with price increases that get absorbed rather than passed through. The $18 pasta dish priced against a 30 percent food cost in 2024 may now sit closer to 36 percent, because base ingredients, packaging, and freight have all moved. The menu price has not. Portion sizes shift almost imperceptibly. A new supplier saves cost per kilogram but introduces more waste in preparation. These movements are individually small and invisible in the daily run of a venue. Compounded across twelve months of trading, they consistently produce a food cost percentage higher than the owner believes it to be.
The EOFY stocktake is the moment this gap becomes quantifiable. A properly conducted stocktake produces a closing inventory value. Combined with opening inventory and food purchases for the period, it generates the actual cost of goods sold for the year. Dividing that by food revenue gives the real food cost percentage. For most hospitality businesses running this calculation carefully for the first time in some years, the number is higher than assumed.
The arithmetic is direct. A café generating $900,000 in annual food revenue running at 36 percent food cost carries $324,000 in ingredient costs. At 32 percent, those costs are $288,000. The $36,000 difference between those two percentages is profit waiting to be recovered through better purchasing decisions, tighter portion discipline, and menu prices that reflect current ingredient costs rather than the cost structure of two years ago.
A cost and margin review across a venue’s menu structure, using EOFY inventory and purchasing data, produces a ranked view of which items carry their weight at current costs and prices, which have become inadvertent loss leaders through cost drift, and where the most available margin improvement sits. For venues running multiple revenue streams across dine-in, delivery platforms, catering, and private functions, the same analysis shows which channel actually generates margin after platform fees and direct costs, and which generates volume without the profit to match.
Labour Percentage and What July Confirms
Labour cost as a percentage of total revenue is the second structural margin number in any hospitality business. For a full-service restaurant or café, total labour costs typically sit between 30 and 38 percent of revenue when wages, superannuation, payroll tax where applicable, and leave entitlements are all included.
Hospitality carries some of the most complex award coverage in the Australian workforce. Casual loadings, weekend and public holiday penalty rates, and shift differentials under the Restaurant Industry Award mean that a Saturday dinner service costs materially more in wage terms than a Tuesday lunch. Most operators know this intuitively. Fewer have run the calculation at the shift level, so that rostering decisions and weekend trading hours are made with a precise view of what each trading period actually costs to staff relative to what it generates in revenue.
From the first full pay period of July, award rates will increase. For a venue with a mix of casual employees across weekend and evening shifts, the real impact once loadings and penalty rates are applied will be noticeably higher than the headline rate percentage when applied to ordinary hours alone. Any menu pricing review should happen before July, not after it, because the wage cost the new menu needs to recover arrives on the first day of the new financial year.
A structured review of the venue’s labour percentage broken down by shift type and trading period shows whether any trading windows are running at negative contribution before overhead is applied. For some venues, this exercise reveals that a specific period, perhaps a quiet Sunday session or a late weeknight close, would produce better results by adjusting hours than by continuing to absorb the staffing cost. Making that decision with precise figures is more useful than making it from a general sense that certain shifts feel thin.
Turning the Stocktake Into a Commercial Conversation
The statutory purpose of an EOFY stocktake is to value inventory accurately so the accounts and the BAS are correct. Your bookkeeper conducts this as part of the standard year-end compliance process, and it is essential for exactly that purpose.
The commercial extension is to use the same data to calculate the real food cost percentage for the year, compare it to the assumed target, identify which categories have drifted furthest, and build the case for a pricing or purchasing adjustment before July’s cost increases compound the problem. Both purposes draw on the same exercise. Only one of them typically gets the attention it deserves.
For hospitality owners thinking about a medium-term exit or eventual sale, the financial picture at EOFY feeds directly into how the business is valued. A café or restaurant where food cost and labour cost are actively managed and sit within target ranges across the year is a structurally more attractive acquisition than one where these numbers are assumed rather than known. An exit readiness diagnostic done after EOFY, when twelve months of complete operating data are available, identifies which of the eight buyer-readiness dimensions deserves attention in the years before a planned transition.
ProfitPulse works with hospitality owners across Queensland and NSW at this point in the calendar. If June has been busy and the stocktake is approaching, building the margin picture from that data before the new wage rates begin is the most useful financial work available in the next two weeks. Book a complimentary 45-minute discovery call with ProfitPulse.
Frequently asked questions
What is a good food cost percentage for a café or restaurant in Australia?
For most Australian café and restaurant models, food cost percentage sits between 28 and 38 percent of food revenue. Fine dining establishments with higher menu prices often achieve the lower end of that range. Casual dining and café models with tighter menu price points commonly sit higher. The more useful benchmark is not an industry average but your own target from when you priced the current menu, compared against your actual figure from the most recent EOFY stocktake calculation.
What is a healthy labour cost percentage for an Australian hospitality business?
Total labour costs, including wages, superannuation, payroll tax where applicable, and accruing leave entitlements, typically sit between 30 and 38 percent of total revenue for full-service café and restaurant models. The complexity in hospitality is that this percentage is not uniform across the trading week. Casual loadings and penalty rates under the Restaurant Industry Award mean Saturday dinner labour carries a materially different cost structure than weekday lunch. Tracking the percentage by trading period shows where the margins sit most cleanly.
Why does my café or restaurant stay busy but not feel as profitable as expected?
In most hospitality businesses, the gap between busyness and profitability traces to one or both of the structural margins: food cost has drifted higher as ingredient prices moved and menu prices did not follow, or labour cost has increased through award rate rises and casual loadings without a compensating adjustment to the venue’s price structure or rostering. Both patterns develop gradually and are often invisible until the year-end numbers make them quantifiable. A busy venue with misaligned food and labour percentages generates strong revenue and modest profit.
How does the July award wage increase affect Queensland cafés and restaurants?
The annual Fair Work Commission wage decision takes effect from the first full pay period of July. For hospitality venues with casual employees working weekend shifts and evenings, the real payroll cost increase is consistently higher than the headline rate percentage once casual loadings and penalty rates are applied to the new base. Any menu pricing review should be completed before July rather than after it, because the cost arrives immediately. A forward cash flow view built in June that incorporates the new rates shows the specific impact on weekly cash before the first payroll of the new year runs.
What can a hospitality business owner do with the EOFY stocktake beyond tax compliance?
The stocktake produces a closing inventory value that feeds the accounts correctly. That same figure, combined with opening inventory and the year’s food purchases, generates the actual cost of goods sold and therefore the real food cost percentage for the year. Comparing that number to the assumed target identifies exactly how far costs have drifted and where a pricing or purchasing correction would have the greatest impact. A cost and margin review built from that EOFY data ranks the recovery opportunities by dollar impact so the most valuable adjustments are made first.
What financial metrics should a café or restaurant owner track every month?
The four numbers that most directly signal the financial health of a hospitality business are food cost percentage, labour cost as a percentage of revenue, gross profit per cover, and cash conversion measured by the gap between trading and supplier settlement. Food cost and labour percentage reveal whether the core economics of the venue are holding. Gross profit per cover tracks whether the customer mix and menu composition are moving in the right direction. Cash timing shows whether a busy month is translating to cash in the account at the expected pace.
What drives the sale price of a café or restaurant in Australia?
Hospitality businesses typically attract two to four times normalised annual profit, with the spread driven by several structural factors. Lease tenure, terms, and any personal guarantee position are significant. Owner dependence in kitchen, front-of-house management, or supplier relationships reduces the multiple. Consistent financial records that show food cost and labour percentages within target ranges across multiple years signal operational discipline to a buyer. Venues with managed cost structures, transferable team capability, and strong lease foundations attract the stronger end of the sector range. A business valuation done before a planned sale establishes the current baseline and the specific levers most worth addressing before the process begins.
Leave a Reply