
Today is World Population Day, and across Australia’s home care and aged care sector it lands on an uncomfortable truth: demand for care is not the problem. An ageing population keeps referrals coming in from every direction, and most home care providers we talk with are not short of clients wanting a service. The problem sits one layer deeper, in what actually happens once a new client is taken on.
Client numbers are the easiest thing to track and the easiest thing to celebrate. A growing client list looks like growth on a dashboard and feels like validation in a leadership meeting. It is also one of the least reliable signals of whether a home care or aged care business is becoming more profitable, because not every client costs the same to serve, and the number that actually decides the outcome is rarely the one anyone is watching.
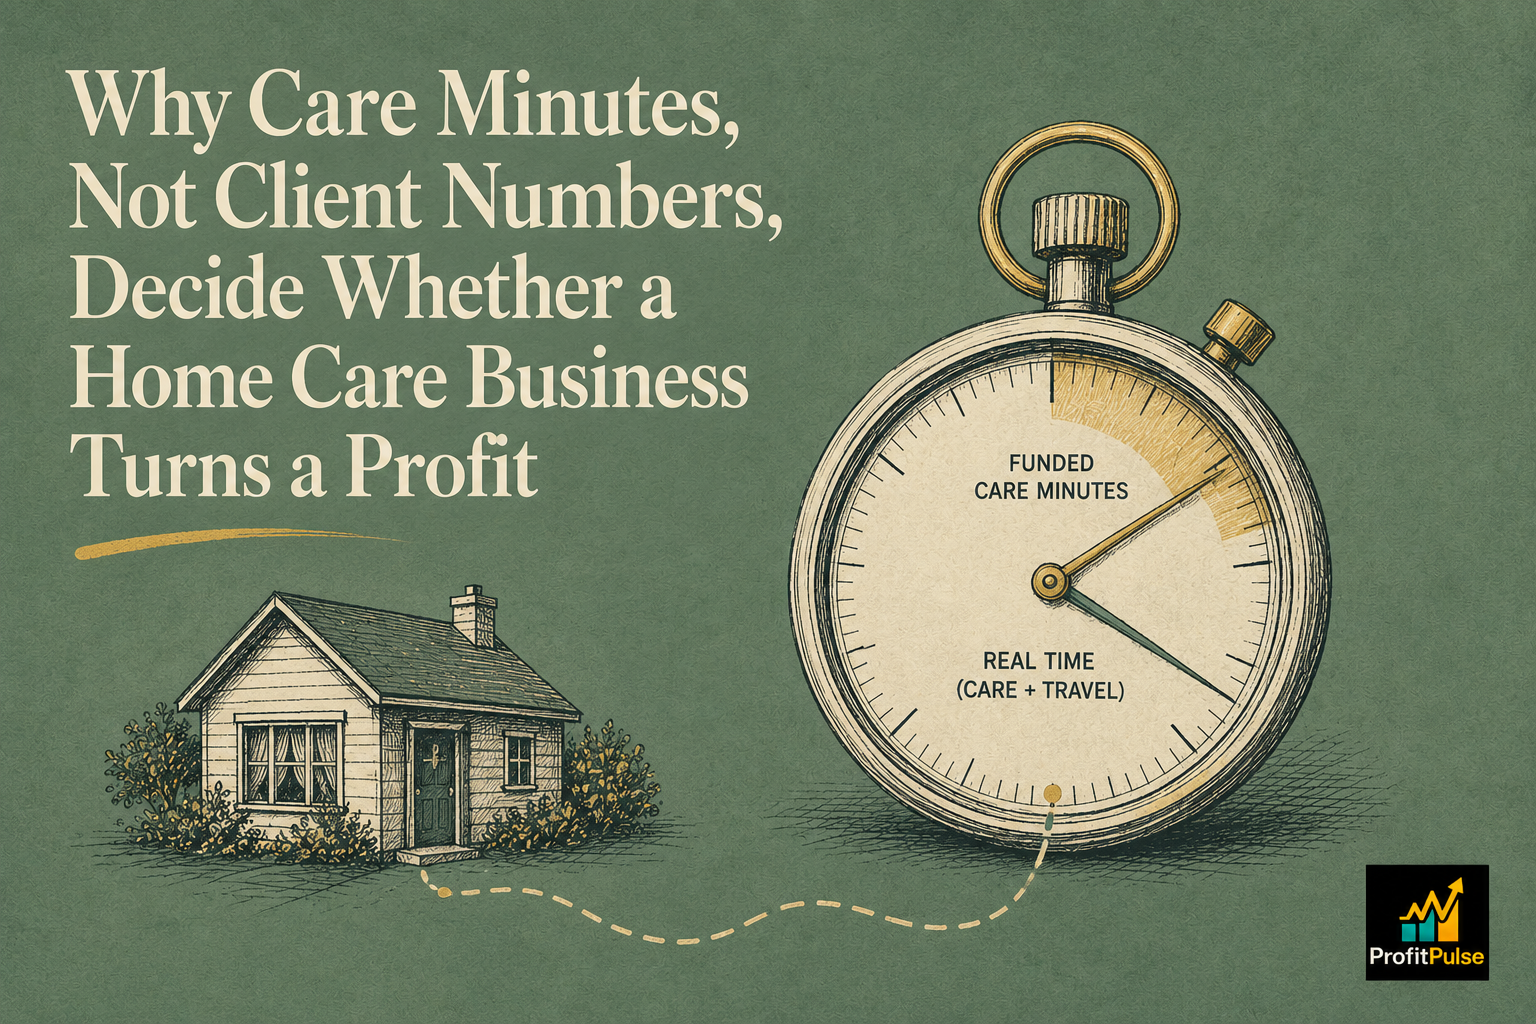
That number is care minutes. Every client comes with a funded package or subsidy that covers a set amount of care time and a defined scope of support. What actually gets delivered against that allocation, once travel, coordination, documentation and roster gaps are counted, is a completely different figure. The gap between the two is where a home care business quietly makes or loses money on every single client it serves.
Client Numbers Are a Vanity Metric in Home Care
The pattern we see across owner-led home care and aged care providers is a client list that keeps growing while the bank balance tells a flatter story. It happens because clients are not interchangeable units of revenue. A client with high support needs, complex medication management or a property that adds twenty minutes of travel each visit can consume far more of a carer’s paid time than a client on a simpler package generating similar revenue. Two clients paying the same fee can have completely different margins once actual time on the ground is measured against it.
This is not a flaw in how a provider runs its business. It is what happens when growth is tracked by headcount rather than by the cost to serve each head, and it rarely shows up until someone sits down and compares funded minutes against delivered minutes, client by client.
The Funding Rate Rarely Matches What the Care Actually Costs
Home care and aged care funding, whether it arrives through a government package, a subsidy or a private top-up fee, is generally set at a rate that assumes a reasonably efficient service. It does not know about the extra fifteen minutes lost driving between two clients on opposite sides of a suburb, the phone call to a family member that runs long, or the incident note that has to be written up before the next visit can start. None of that is unusual. It is simply the reality of delivering a personal service in someone’s home rather than in a clinic or a facility, and it needs to be built into the cost of delivery rather than absorbed as an unplanned loss at the end of the month.
The providers who manage this well are not the ones with the lowest wage costs. They are the ones who have actually costed a visit properly, travel and coordination included, and compared that real cost against what each package or funding tier brings in. Without that comparison, a roster can look full and a client base can look healthy while the business is steadily eroding margin on its busiest days.
Where the Margin Actually Leaks: Travel, Coordination and Roster Gaps
Three things account for most of the gap between funded care minutes and paid staff time in a home care business: travel between visits that is rarely built into rostering with enough buffer, coordination and administration time that grows with every additional compliance requirement, and roster gaps created by short-notice cancellations that still cost a carer’s rostered hour even when no service is delivered. Individually, each looks like a small operational inefficiency. Together, across a caseload of a hundred or more clients, they are usually the difference between a home care provider that is comfortably profitable and one that is working harder for less every year.
A workforce capacity and utilisation review is built for exactly this problem, measuring how staff time actually converts into billable, funded care minutes and where the unpaid hours are hiding in the roster. For providers managing multiple funding streams and private clients across Queensland, NSW or Victoria, that visibility usually matters more to the bottom line than winning the next referral.
None of this means home care and aged care providers should chase fewer clients. It means the client list stops being the scoreboard and the care minutes calculation starts being the one leadership actually watches month to month. Bringing a fractional CFO into that calculation, alongside the funding mix and the roster, turns a business that feels busy into one that can show exactly where its margin comes from. If that comparison has never been run properly in your business, book a discovery call with ProfitPulse and we can walk through what it would take.
Frequently asked questions
How do home care providers work out if a client is actually profitable?
The starting point is comparing the funded care minutes in a client’s package against the actual time a carer spends on visits, travel and coordination for that client. Clients on the same package fee can have very different margins once real time on the ground is counted. A customer concentration and profitability review ranks every client this way, showing which parts of a caseload are genuinely carrying their weight.
What counts as a healthy staff utilisation rate for a home care business?
There is no single benchmark that fits every provider, because travel time, client density and package mix all change the picture. What matters more than any single number is whether the business has actually measured the gap between rostered hours and funded, billable care minutes, since that gap is usually where the real answer to the profitability question sits.
Why do home care and aged care margins shrink even as client numbers grow?
Growth usually adds clients faster than it adds the rostering, travel and coordination capacity needed to serve them well. Without a clear view of the true cost to deliver each package, new clients can be taken on at a rate that quietly dilutes overall margin, even while total revenue keeps climbing.
How much travel time should be built into home care rostering?
Travel time varies too much by suburb density and client spread to set one rule for every provider, but the mistake we see most often is rosters built around visit time alone, with travel treated as a rounding error rather than a real cost. Building travel into the true cost of each visit is what turns a rostering plan into an accurate margin picture.
Is a fractional CFO useful for a home care or aged care provider?
Very much so, particularly once a provider is managing several funding streams, a growing roster and private top-up clients at the same time. A fractional CFO partnership brings the monthly discipline of tracking care minutes, funding mix and margin together, rather than reviewing each in isolation once a quarter.
What financial reports should a home care provider review every month?
At minimum, a monthly view of margin by client or package type, staff utilisation against rostered hours, and a rolling cash position that accounts for funding payment timing. The guide on cash flow discipline is a useful starting point for providers building this rhythm for the first time.
Leave a Reply