
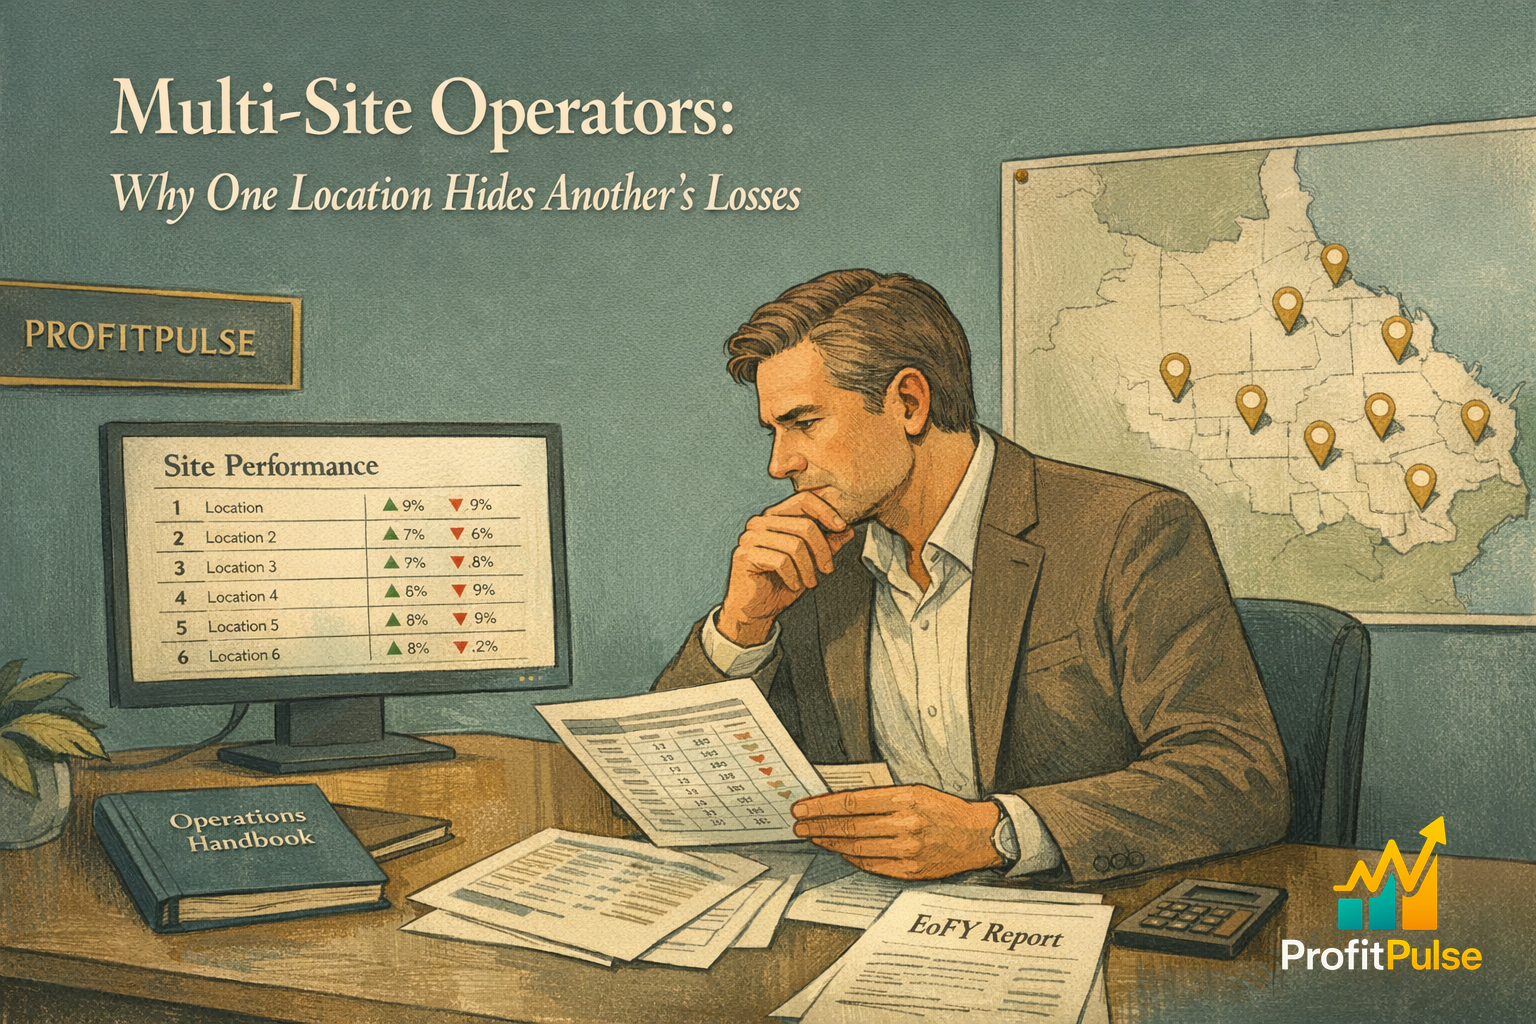
A multi-site operator looks at the group result and sees a number that, on balance, looks fine. Revenue is up, profit is steady, the year held together. What that single figure does not show is that one strong location may be quietly carrying a weaker one, and that the owner is making capital and attention decisions on a blended number that hides exactly the detail they most need. As the financial year closes and everything consolidates into one set of accounts, that blending gets worse, not better.
This is one of the most common patterns across franchise systems and multi-site businesses. The group looks healthy, so nothing demands attention, while a single underperforming site sits inside the average, losing money every month, invisible behind a sibling that is doing better than its share.
The blended number is the enemy of good decisions
Site-level profitability is the figure that matters, and the group result actively obscures it. When three sites are read as one, a strong performer and a weak one average into something unremarkable, and the owner has no signal that anything is wrong. The weak site keeps consuming capital, management time and royalty and marketing fund contributions, while the strong one subsidises it without anyone deciding that it should.
The cost of this is not only the losses at the weak site. It is the capital and attention that the weak site absorbs and the strong site could have used. A multi-site owner working off a blended result is, in effect, making their best location fund their worst, year after year, without ever choosing to. Seeing each site on its own is the first step to changing that. The same is true of management time, which is just as finite as capital. Hours spent propping up a struggling location are hours not spent helping a strong one grow, and the blended number hides that trade-off completely.
Read each site as its own business
The discipline is to treat every location as a standalone operation with its own profit and loss, its own same-store growth, and its own contribution after royalty economics and marketing fund are accounted for. Read this way, the picture sharpens immediately. The strong site’s real strength shows, the weak site’s real drag shows, and the owner can finally ask the right question, which is where capital and effort actually belong.
A KPI Dashboard Build & Run built for a multi-site operation does exactly this, presenting the eight to twelve numbers that matter for each site side by side, so site-level profitability is visible at a glance rather than buried in a consolidated total. The aim is for the owner to read the group and each site in the same moment, and to direct capital allocation across sites on evidence rather than on the blended average. Once the numbers sit side by side, a conversation that used to be about the group as a whole becomes a sharper one about which specific site needs what, which is where real decisions get made.
Breaking the year apart by site often surfaces something more useful than a problem to fix. It reveals what the strong location is doing right, in a form that can be carried to the others. The site with the better labour model, the tighter cost control, or the stronger local trade is no longer just a good number in the average; it becomes a working example the rest of the group can learn from. Read this way, the year-end consolidation stops being the moment the detail disappears and becomes the moment it is most visible. The owner walks into the new year knowing not only which sites need attention, but which one holds the playbook worth spreading, which is a far more productive read than a single group total could ever offer an owner planning where the next year of capital and attention should go.
Let year-end sharpen the sites, not blur them
EOFY is the moment when everything gets consolidated, which makes it the moment the blending is at its worst and the site-level truth at its most useful. An owner who breaks the year-end result back into its locations sees which sites earned their keep, which leaned on others, and where next year’s capital and attention should go. That is a far stronger position than reading a single group figure and assuming the average tells the story.
This is steady commercial reading applied to a multi-site structure, the same discipline that runs through our broader commercial insights. Operators across Brisbane who read their sites individually consistently find a clarity the group number never gave them. The consolidated total has its place for tax and for the bank, but for deciding where the next dollar and the next hour go, the site-level view is the one that actually guides the owner. ProfitPulse helps multi-site owners see each location clearly, so capital follows performance rather than the average.
Frequently asked questions
Why does a group result hide a weak location’s losses?
Because a single blended figure averages a strong site and a weak one into something unremarkable, so nothing signals that anything is wrong. The weak site keeps consuming capital, management time and fund contributions while a stronger sibling subsidises it. Reading site-level profitability rather than the group total is what reveals the detail the average conceals. A KPI Dashboard Build & Run shows each site side by side so the hidden losses become visible.
How should a multi-site owner read profitability by location?
Treat every location as a standalone business with its own profit and loss, its own same-store growth, and its own contribution after royalty economics and marketing fund. Read this way, the strong site’s real strength and the weak site’s real drag both show clearly. The owner can then direct capital and effort on evidence rather than on a blended average. Reading each site individually consistently surfaces a clarity the group number never provided.
What is site-level profitability and why does it matter?
It is the profit each location earns in its own right, after its share of royalties, marketing fund and direct costs, rather than blended into a group total. It matters because capital and attention decisions made on a group figure quietly let a strong site fund a weak one, year after year, without anyone choosing it. Seeing each site on its own is what lets an owner direct resources to where they actually pay rather than to the average.
Why is EOFY a risk for multi-site operators reading their numbers?
Because year-end consolidates everything into one set of accounts, which is exactly when the blending is at its worst. A single group figure at EOFY hides which sites earned their keep and which leaned on others. Breaking the year-end result back into its locations turns that risk into the most useful read of the year, showing where next year’s capital and attention should go rather than leaving the average to tell a misleading story.
How can a Brisbane franchisee improve capital allocation across sites?
Start by reading each location as its own business, then direct capital to where the evidence shows it pays rather than to the blended average. A weak site absorbing capital and management time is, in effect, funded by a strong one unless the owner sees the split and decides otherwise. Operators across Brisbane who read their sites individually consistently allocate capital with a clarity the consolidated group number never gave them.
What does same-store growth tell a multi-site operator?
It shows whether each existing location is genuinely improving, separate from growth that comes only from adding sites. A group revenue rise can mask flat or declining performance at established locations if new sites are doing the lifting. Reading same-store growth per site, alongside site-level profit, tells an owner which locations are strengthening on their own merits and which need attention, rather than letting new-site momentum hide a problem in the existing base.
Leave a Reply