July 1 is one of the most operationally loaded dates in the NDIS provider calendar. The Social, Community, Home Care and Disability Services Industry Award (SCHADS Award), which covers most disability support workers across Queensland, NSW, and Victoria, rolls over to its updated rates from the first full pay period of the month. The NDIS Pricing Arrangements and Price Limits, the document that sets the maximum rates providers can claim for each registered support category, is also updated annually with July 1 as the standard effective date.
Both events land at the same time. The wage cost moves immediately. The pricing update flows through to provider accounts considerably more slowly.
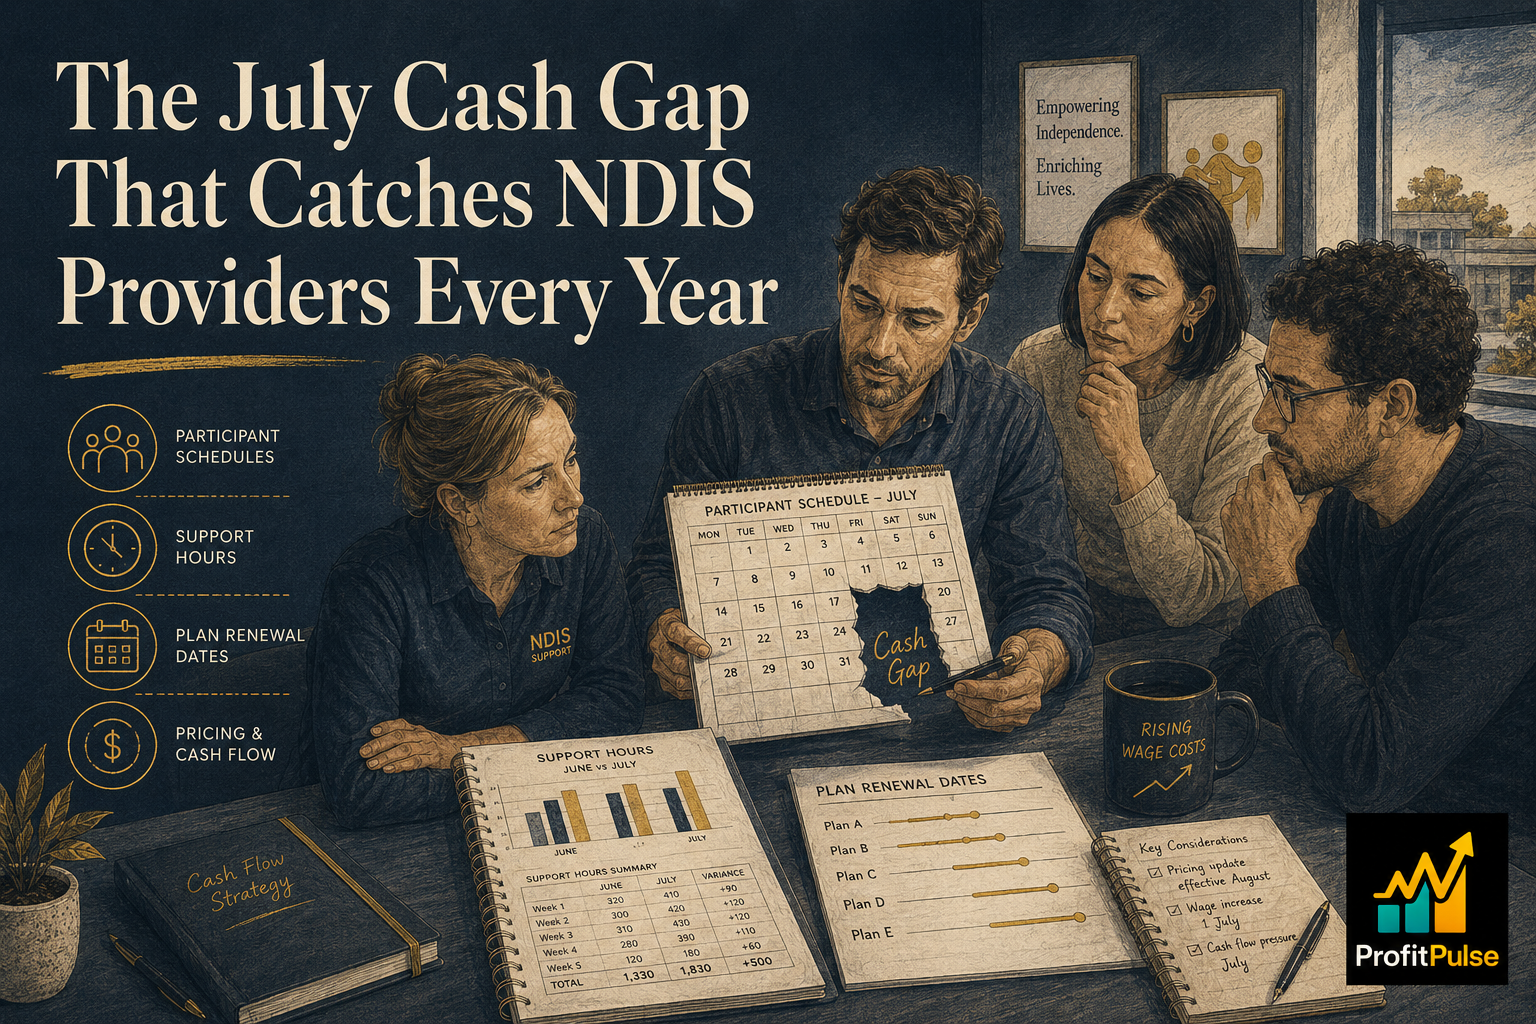
This timing gap, between the moment labour costs increase and the moment new support prices can actually be claimed against active participant plans, is the structural source of the July cash and margin pressure most NDIS providers experience each year. The gap is predictable. What varies is how well each provider has planned for it, and whether the June 30 data available has been used to map the specific exposure before July begins.
Why New Pricing Does Not Land When You Think It Does
For participants whose plans are agency-managed, updated support prices can generally be claimed from July 1 once the provider has updated its claim rates in the NDIS portal. The process requires attention but the timing is reasonably aligned with the wage increase.
Agency-managed participants represent one stream. A significant proportion of the NDIS participant population uses plan-managed arrangements, where an NDIS-registered plan manager processes claims on the participant’s behalf. Under this model, the provider invoices the plan manager rather than claiming directly from the NDIA. Updated pricing under plan-managed arrangements requires service agreement amendments and plan manager confirmation, which introduces a processing lag of one to several weeks depending on the plan manager’s capacity during the same July transition period.
Self-managed participants present a different timing profile again. These participants hold their own funding and pay providers directly, then seek reimbursement from the NDIA. Updated pricing must be reflected in new service agreements, and the participant approves changes at their own pace.
Most NDIS providers carry a mix of participant management types across their service portfolio. The practical effect is that the wage increase applies to every shift from the first full pay period of July, while updated pricing reaches the accounts at different speeds depending on each participant’s management type. The aggregate margin through July and early August is structurally lower than it will be once all plans are updated. For providers who have not modelled this mix, the July result is a reliable source of surprise each year.
What the Participant Portfolio Looks Like at June 30
The EOFY is the natural moment to review the composition of the participant portfolio and the financial patterns it produces. With twelve months of support delivery data available, two questions become answerable that are harder to assess in the middle of the year.
The first is which support categories are actually generating positive margin at current price limits. NDIS support categories carry different rates and attract different cost structures. Community access supports may require more staff time per hour than behaviour support or support coordination. Personal care and domestic assistance vary by shift timing, weekend and public holiday loadings, and travel time allowances. A provider who knows which support types produce the best margin for their staffing model is in a different position when the pricing update lands than one operating from an aggregate view of the business.
The second question is which participants’ plans are due for renewal, and what happens to service delivery if a plan is not renewed before the existing funding exhausts. Gaps in participant plans create gaps in provider revenue. Knowing the renewal schedule across the portfolio before June 30, and having active conversations with support coordinators and nominees for any plans approaching their end date, is one of the most direct working capital improvements available.
A Cost and Margin Deep Dive across the support category mix surfaces these patterns using the year’s complete data. The output is a view of which service types to protect at current pricing, which need to be examined for delivery efficiency, and where workforce deployment decisions could improve the margin picture without requiring a price change. For providers carrying a high proportion of plan-managed participants, a Working Capital Unlock maps the cash timing across management types and identifies the actions most likely to reduce the July-August gap before it opens.
The Longer View for Providers Thinking About Growth or Exit
For disability services providers thinking about their medium-term direction, the financial picture at June 30 creates a moment of genuine strategic clarity. The NDIS sector is consolidating. Larger providers with broader service footprints and diversified support category mixes are acquiring smaller, specialist providers across Queensland and NSW. The valuation multiples in this sector are driven significantly by workforce stability, participant retention rates, and the absence of over-dependence on a single funding stream or a narrow support category range.
An Exit Readiness Diagnostic at this stage of the financial year scores the business across the structural dimensions buyers in the disability services sector most closely examine: financial quality, participant concentration, workforce depth, registered provider scope across support categories, and the degree to which service delivery depends on the owner personally.
The July pressure returns every year. The providers who plan for it in June are the ones whose July results look closest to the year that preceded them. ProfitPulse works with NDIS and disability services providers across Queensland and NSW, building the participant-level and service-category financial clarity that turns the EOFY accounts from a compliance document into a tool for better decisions in the year ahead. Book a complimentary 45-minute discovery call with ProfitPulse.
Frequently asked questions
How does the annual NDIS Pricing Arrangements update affect my provider income?
The NDIS Pricing Arrangements and Price Limits document, updated annually with July 1 as the standard effective date, sets the maximum amounts providers can claim for each registered support category. When an update increases price limits, providers can claim higher rates, but only from participants whose service agreements have been updated to reflect the new pricing. For agency-managed participants this happens through the NDIS portal; for plan-managed and self-managed participants, a service agreement amendment is required, which introduces a processing lag before the new rates reach the provider’s accounts.
Why does cash feel tight for NDIS providers at the start of each new financial year?
The SCHADS Award wage increase takes effect from the first full pay period of July, raising the cost of every support shift immediately. Updated NDIS pricing also applies from July 1 but flows through to provider accounts at different speeds depending on each participant’s plan management type. Agency-managed claims update quickly; plan-managed arrangements require processing through the plan manager; self-managed participants move on their own timeline. Wages increase ahead of revenue in the same pay cycle, creating a predictable margin gap. A forward cash flow model built in June maps this window before it opens.
What is the difference between agency-managed, plan-managed, and self-managed NDIS funding?
Agency-managed participants have the NDIA manage their funding and pay registered providers directly through the NDIS portal, typically within three working days of a claim. Plan-managed participants use an NDIS-registered plan manager who pays providers on their behalf, typically within five to fifteen working days. Self-managed participants hold their own funding and pay providers directly. Each management type creates different cash timing for the provider, and a participant portfolio weighted toward plan-managed and self-managed arrangements tends to produce slower cash receipts, particularly during the July pricing transition.
How do I know which NDIS support categories are most profitable for my business?
Start with the price limit for each support category you deliver, then subtract the direct staff cost per hour including SCHADS Award rates, loadings, and travel time, and allocate a share of supervision and administration overhead. What remains is the contribution margin per support hour by category. Most NDIS providers find meaningful variation across their support type mix, with some categories generating strong margin per hour and others running close to cost once loadings and travel are included. EOFY is the natural moment for this analysis using the year’s complete delivery data.
What financial review should an NDIS provider prioritise at the end of financial year?
Three reviews produce the most value from the year’s complete data. First, a support category margin analysis to identify which registered support types generate the best contribution per staff hour at current price limits. Second, a participant plan renewal schedule review to map upcoming renewals and initiate conversations with support coordinators for any plans approaching their end date. Third, a workforce utilisation review examining the proportion of paid hours that convert to billable supports versus rostering, travel, and administration. A structured financial review at this point turns the EOFY data into a ranked action list for the year ahead.
What valuation multiple does an Australian NDIS or disability services business typically attract?
NDIS provider businesses typically attract three to five times normalised annual profit for owner-operated services, with higher multiples available for businesses with workforce depth, registered provider scope across multiple support categories, participant retention data demonstrating stable utilisation, and management that operates independently of the founder. Sector consolidation has increased buyer interest and strategic acquirers in some cases pay above this range for services that complement an existing geographic footprint or support capability. Business valuations for Queensland SMEs includes disability and aged care service businesses specifically.
Does an NDIS provider business benefit from fractional CFO support in Australia?
For disability services businesses between two and fifteen million in annual revenue, a fractional CFO arrangement typically brings the support category margin tracking, participant plan cash flow forecasting, and workforce utilisation monitoring that most provider owners manage reactively or not at all. The July transition planning alone, modelling the wage-to-pricing timing gap by participant management type before the financial year closes, typically produces a cash flow benefit in the first year that exceeds the cost of the engagement.
Leave a Reply