Revenue is the number that goes on the whiteboard. It gets discussed at team meetings, cited in year-end reviews, and used as the shorthand for how the business is performing. A year where revenue has grown tends to feel like a year that has gone well.
Gross margin percentage tells a more precise story. It measures the share of revenue remaining after the direct cost of delivering each product or service is subtracted, distinct from net profit, which also carries overhead, salaries, and operating costs. While revenue describes how much business flowed through, gross margin percentage describes whether the business became more or less profitable per dollar of activity as that flow increased. It is the middle layer of the financial picture, and in most owner-led businesses, it is the least consistently tracked.
For many Australian SMEs, that percentage has been drifting in the wrong direction for longer than the owners realise. The drift tends to be gradual, a point here and two points there, and it hides inside revenue growth that feels strong until the profit available at year end tells a quieter story.
The Three Ways Gross Margin Drifts Without Being Noticed
Input cost inflation that is absorbed rather than passed through is the most common source. When a supplier increases their price by four per cent and the business continues charging the same rates to customers, the gross margin falls on that input immediately. If the input represents a significant share of cost of goods, the overall margin percentage moves visibly across the year. Most businesses recognise this is happening but delay the pricing response because raising prices feels uncomfortable, particularly when customers are also under cost pressure. The financial effect accumulates regardless.
Mix shift is subtler. The business’s revenue is growing, but the growth is concentrated in categories with lower margins than the business average. A services firm growing through high-volume project work that carries thinner margins than its core advisory relationships will show strong revenue growth alongside falling gross margin percentage. A product business whose fastest-growing lines carry below-average margins is in the same position. The growth is real. The mix shift is working quietly against it, and neither pattern is visible from the revenue line alone.
Scope creep in service businesses is the third pattern. The scope of what is delivered for a given fee tends to expand over time, through additional deliverables, extended timeframes, and client requests that sit just outside the original brief. When these expansions are absorbed without renegotiation, the effective margin on each engagement falls. Over the course of a year, a business with persistent scope creep can deliver considerably more value than it captures in revenue, and the gross margin percentage reflects that gap. Identifying and repricing scope that has drifted is one of the more immediate levers available to a service business at this point in the year.
Why the Percentage Matters More Than the Dollar Amount
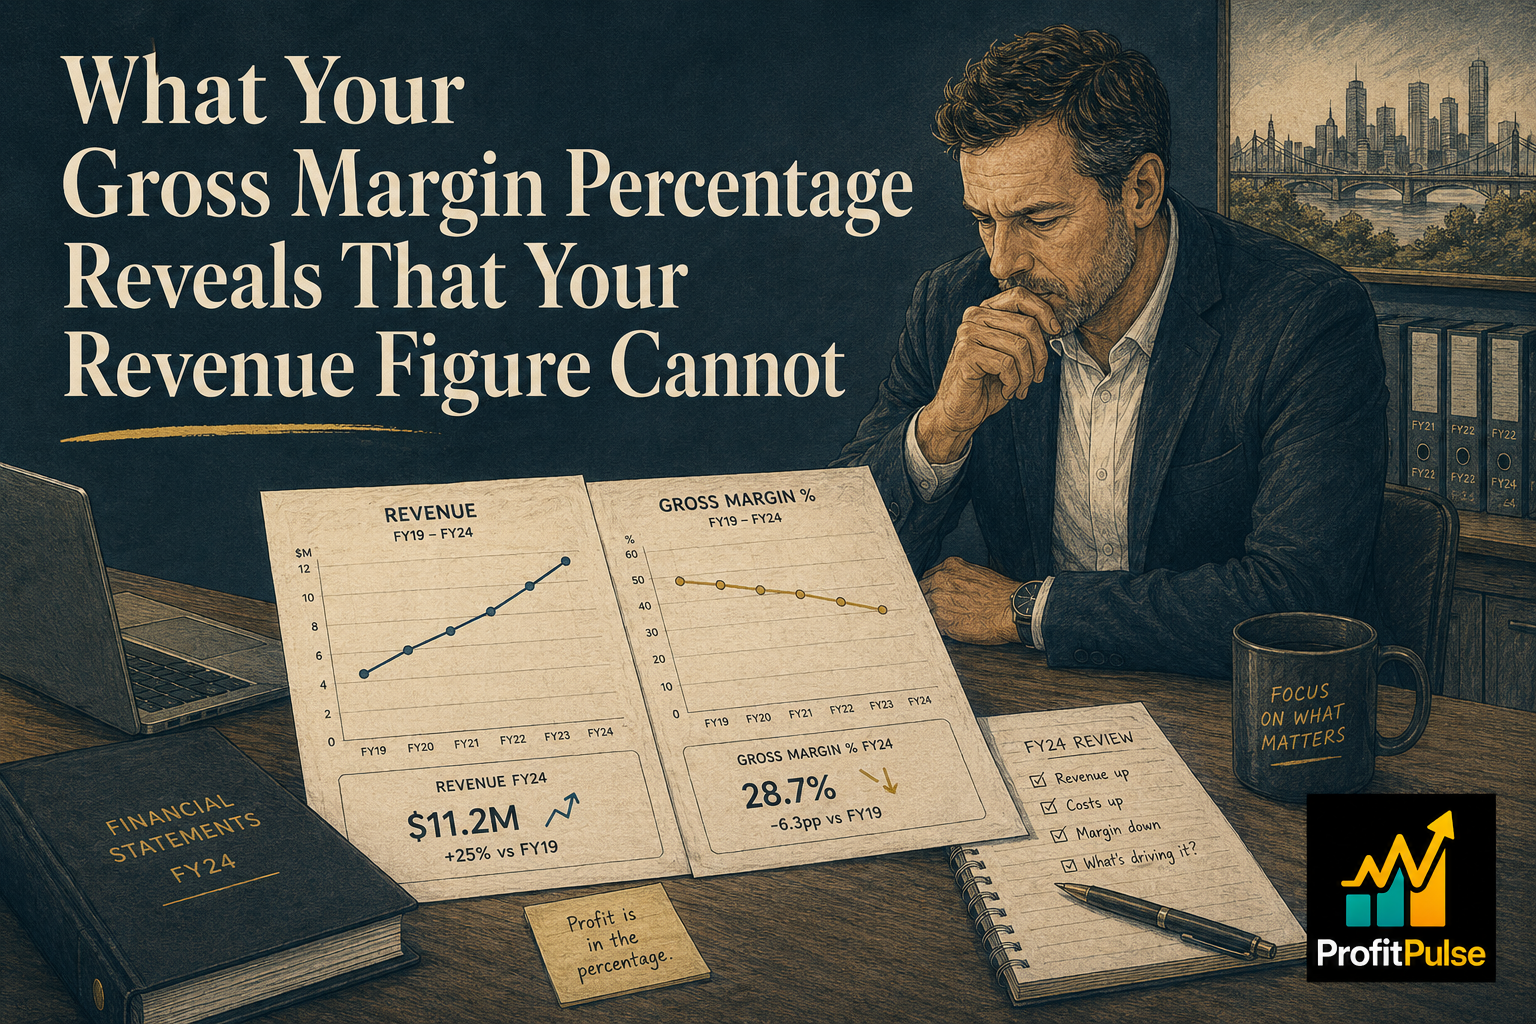
It is possible for a business to report higher gross profit in dollar terms each year while its gross margin percentage falls. Revenue growth of 20 per cent paired with three points of margin compression produces a business generating more top-line activity and more absolute gross profit while becoming structurally less efficient per dollar of revenue.
The percentage is the signal. The dollar amount misleads. For most owner-led businesses in the $1 million to $10 million revenue range, a single percentage point change in gross margin means $10,000 to $100,000 in annual profit movement depending on scale. Compounded over three or four years of quiet drift, that represents a material change in the wealth the business generates for its owner, even when the revenue trajectory looks consistently healthy. A business that averaged 54 per cent gross margin in its earlier years and is now running at 50 per cent has surrendered four points. At $5 million in revenue, those four points are $200,000 in annual profit that is no longer available.
Tracking the trend across years, rather than checking the point-in-time figure in the most recent P&L, reveals whether the business is becoming more efficient or less as it grows.
What EOFY Finally Makes Possible to See
With twelve months of complete data available, the period immediately after June 30 is the natural moment to calculate the trailing gross margin percentage and compare it to the prior two or three years. Annual gross margin percentages plotted across three years reveal whether the trend is stable, improving, or drifting in a way that single-year comparisons alone can miss.
If the margin percentage has held or improved, the business has genuine pricing discipline or cost management worth understanding explicitly so it can be protected. If it has drifted, the EOFY data shows which cost lines moved faster than revenue and which product or service categories contributed most to the shift. A Cost and Margin Deep Dive across the business’s revenue lines takes this further, ranking every category by gross margin and identifying where the repricing or mix decisions have the highest expected dollar impact.
The typical outcome of a Pricing Reset built on this analysis is 200 to 500 basis points of gross margin improvement across the business. At $3 million in revenue, 300 basis points is $90,000 in additional annual profit, recurring, without new customers and without additional overhead.
For many businesses, the EOFY review reveals that margin drift has been compounding for two or three years. The sooner that picture is established, the more corrective options remain available. ProfitPulse works with owner-led businesses across Queensland and NSW at exactly this point in the year, building the gross margin trend view that turns a general sense of tightening profitability into a specific, addressable finding. Book a complimentary 45-minute discovery call with ProfitPulse.
Frequently asked questions
What is gross margin and how does it differ from net profit?
Gross margin is the revenue remaining after subtracting the direct costs of producing your product or delivering your service, things like materials, direct labour, freight, and subcontractor costs. Net profit is what remains after gross profit is further reduced by overhead, salaries, rent, depreciation, and interest. Gross margin percentage is calculated as gross profit divided by revenue. It measures whether the core activity of the business is becoming more or less efficient over time, independently of how overhead is structured.
What is a good gross margin percentage for an Australian small business?
It varies significantly by industry. Manufacturing businesses often operate at 25 to 45 per cent. Professional services and consulting firms typically achieve 50 to 70 per cent or higher. Retail commonly sits at 30 to 50 per cent. Hospitality trades between 60 and 75 per cent on food and beverage lines before overhead. The most useful benchmark is not an industry average but your own three-year gross margin trend, which reveals whether the business is improving or quietly drifting.
Why is my gross margin falling even though my revenue is growing?
In most Australian SMEs, falling gross margin alongside revenue growth traces to one of three patterns: input costs have risen and prices have not moved to match; revenue growth is concentrated in lower-margin products or services rather than the highest-margin categories; or the scope of what is delivered has expanded without repricing. Revenue growth alone does not fix gross margin compression. Each pattern requires a specific response at the pricing, product mix, or costing level.
How do I find my gross margin percentage using Xero or MYOB?
In Xero or MYOB, run a Profit and Loss report for the period and look at the gross profit line, then divide by total revenue for the percentage. The critical step is ensuring your chart of accounts correctly separates direct costs from operating overhead. If direct costs have been miscategorised as overhead, the gross margin will appear overstated. Your bookkeeper can confirm the classification is correct before you use the figure for year-on-year trend analysis.
How much does a one percent improvement in gross margin change my annual profit?
At $1 million in revenue, one percentage point of gross margin improvement adds $10,000 to annual profit, assuming overhead stays flat. At $5 million it is $50,000. At $10 million it is $100,000. This is why gross margin improvement produces a compounding return each year without requiring additional revenue or new customers. A business that lifts gross margin by three points at $4 million in revenue adds $120,000 annually to its result, recurring.
How do I review gross margin properly at the end of financial year?
Calculate the gross margin percentage for the financial year just closed and compare it to the prior two years in the same format. If the percentage has fallen, identify which cost lines grew faster than revenue and which product or service categories sit below the overall average. A Cost and Margin Deep Dive takes this further, ranking every revenue line by margin and producing a clear kill, fix, or scale decision for each, so the year ahead is built on a precise view of what is actually working.
Can a fractional CFO help improve gross margin for an SME in Brisbane?
One of the practical benefits a fractional CFO arrangement brings to an owner-led business is consistent tracking of the financial metrics that tend to drift when the owner is focused on operations. Gross margin percentage, monitored monthly, reveals input cost shifts, mix changes, and scope creep before they compound into a material problem. Most owner-led businesses find that regular tracking prevents more value erosion than any single intervention at year end.
Leave a Reply