
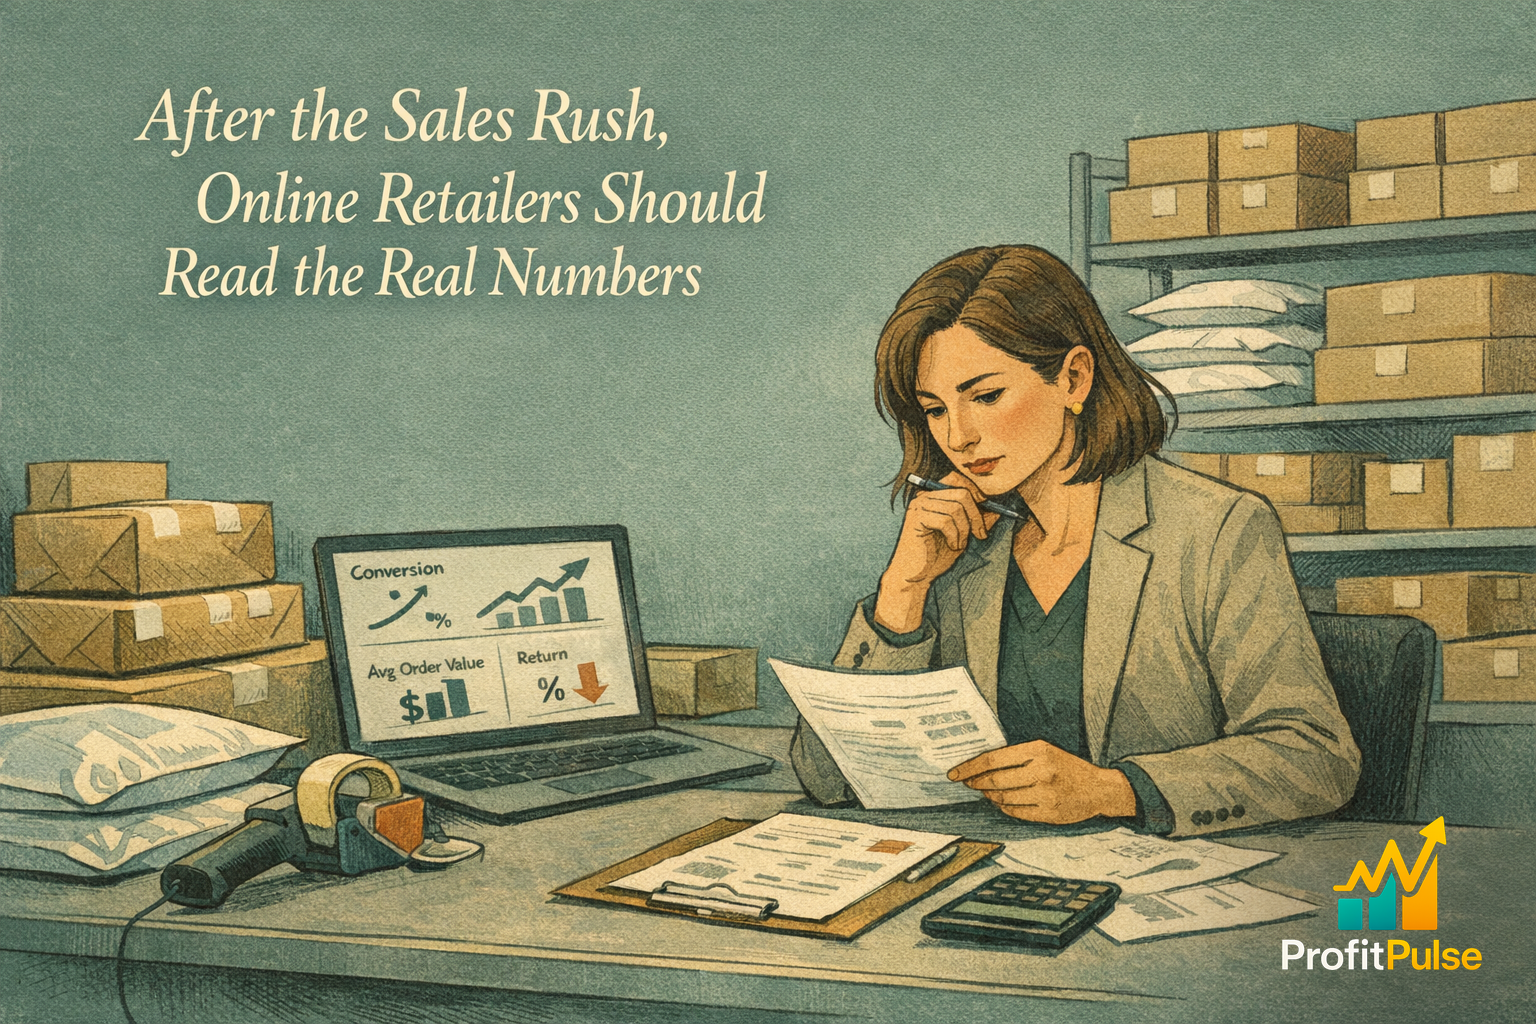
The peak is over. The November and December rush, with its discounts, its ad spend and its surge of orders, has passed, and the volume figures look impressive. For most e-commerce businesses, this is the moment to celebrate a big number and move on to the next campaign. It is also the moment that quietly decides whether the rush was worth running.
Revenue during a discounting season is the easiest number to admire and the least informative. It tells you how much the business sold, not how much it kept. The real result sits underneath: what each order actually earned once the discount, the acquisition cost, the shipping and the returns are all counted. The post-peak lull, when the orders slow and there is finally time to look, is exactly when that reconciliation should happen, while the season’s data is fresh.
What the peak actually earned per customer
The two numbers that reframe a discounting season are customer acquisition cost and contribution margin per order. A campaign that doubled order volume can still have gone backwards if the cost of winning each new customer outran what the order contributed after discount and fulfilment. Plenty of strong-looking peaks are, on honest accounting, a way of buying revenue at a slight loss and hoping the customer comes back.
Which makes repeat purchase rate the figure that decides everything. A new customer acquired at a high cost during the peak only justifies that cost if they buy again at full margin later. If the first discounted order is also the last, the acquisition was an expense, not an investment. If a meaningful share return through the year, the maths changes completely. You cannot know which it is until you watch the post-peak weeks, which is why this lull is not dead time. It is when the verdict comes in.
Return rate quietly distorts the whole picture. A category with strong headline sales and a high return rate can contribute far less than its revenue suggests, once the cost of processing, restocking and writing off returned stock is counted. Until returns settle in January, the peak’s real margin is not yet knowable, which is another reason the reconciliation belongs here rather than in December’s afterglow.
The discount itself deserves an honest line in this read, because it is the cost that hides in plain sight. A line marked down thirty percent to move volume through the peak gives away thirty percent of its margin on every unit sold, and at a thin starting margin that can mean the order contributes almost nothing once fulfilment is added. The volume looks like success while the contribution quietly disappears. Separating the genuinely profitable peak sales from the ones that simply shifted stock at or below cost is often the single most useful thing the post-peak read produces, because it shows which promotions are worth repeating next year and which only flattered the revenue line.
Find the channels and products worth keeping
Channel mix is where the post-peak read becomes genuinely useful for the year ahead. Different acquisition channels deliver customers at very different costs and very different repeat behaviour. One channel might bring cheap first orders that rarely return, while another brings dearer customers who become loyal. The headline blends them into a single number that hides both. Pulling them apart shows where next year’s spend belongs.
The honest version of this measures each channel on the customer it delivers, not the order it generates. A channel that wins a first order at a slim loss can still be the best investment the business makes if those customers come back three times at full margin, while a channel that turns a small profit on the first order but never sees the customer again is the one quietly capping growth. Judging channels on the first transaction alone is how a business ends up spending the most on the customers worth the least, then wondering why the volume rose but the bank balance did not.
The same logic applies to products. Some lines drive volume but contribute little after discount and returns, while others quietly carry the margin. A Customer Concentration and Profitability Map ranks customers and the orders behind them by genuine contribution rather than revenue, which usually reveals that the best customers are not the highest-spending ones, and that a slice of headline sales is quietly losing money. For an online retailer reading a discounting season, that ranking is the difference between repeating what worked and repeating what merely looked busy.
Our insights on customer profitability work through how to separate the orders worth winning from the ones that only added volume.
The lull is where the year is shaped
The instinct after a big peak is to move quickly to the next thing. The more valuable instinct is to pause long enough to learn what the peak actually taught. The data is at its richest right now, before it ages and before the next campaign overwrites the lesson. An honest read of acquisition cost, contribution per order, repeat rate and returns turns a season of activity into a plan for where to spend, what to stock and which customers to court.
Brisbane and the wider East Coast carry a deep e-commerce base, and the operators across Brisbane who use the quiet weeks to reconcile their peak start the year knowing which of their numbers to trust. That clarity is the work we do with online retailers, and the lull is the best moment of the year to do it.
Frequently asked questions
Why should e-commerce businesses analyse their results after the sales peak?
Because peak revenue tells you how much you sold, not how much you kept. The real result, what each order earned after discount, acquisition cost, shipping and returns, only becomes clear once the post-peak weeks settle. The lull is when the data is freshest and the orders have slowed enough to look properly. Reconciling now turns a season of activity into a plan for where to spend next.
What is contribution margin per order in online retail?
It is what a single order actually adds to the business after the discount, the cost of acquiring that customer, shipping and any returns are subtracted. A campaign can double order volume and still go backwards if acquisition cost outran contribution. Looking at contribution per order, rather than headline revenue, is what tells you whether the discounting season built value or merely bought volume at a slight loss.
How does customer acquisition cost affect peak season profit?
Acquisition cost is what you paid to win each new customer through advertising and discounting. During a peak, that cost can rise sharply. The order only justifies it if the customer buys again at full margin later. If the discounted first order is also the last, the acquisition was an expense. Watching repeat purchase rate in the weeks after the peak is how you tell which it was.
Why does return rate matter when measuring peak performance?
A category with strong headline sales and a high return rate can contribute far less than its revenue suggests, once processing, restocking and write-offs are counted. Until returns settle in January, the peak’s real margin is not yet knowable. That is a key reason the reconciliation belongs in the post-peak lull rather than in December, when the returns have not yet come back to reveal the true result.
How can a Brisbane online retailer find its most profitable customers?
Rank customers and their orders by genuine contribution rather than spend, which usually reveals that the highest-spending are not the most profitable. A Customer Concentration and Profitability Map separates the orders worth winning from those that only added volume, accounting for acquisition cost and returns. Our Brisbane work with online retailers focuses on reading the peak honestly so next year’s spend goes where it pays.
Which channels should I keep investing in after a discounting season?
Pull the channels apart rather than reading a blended number. Different channels deliver customers at very different costs and very different repeat behaviour. One might bring cheap first orders that rarely return, another dearer customers who become loyal. The headline hides both. Our insights on customer profitability walk through how to separate the channels worth keeping from those that only looked busy.
Leave a Reply